Glider Safety Analysis

safeGlide

Turn your IGC flight logs into a clear picture of when, where, and how often you flew close to the edge — and how your risk exposure has changed as you gained experience.

No install, no upload. The full analysis engine runs in your browser — your flight logs never leave your machine.

Overview

What is safeGlide?

safeGlide is a personal toolkit for soaring pilots that reviews recorded flights for risky flying situations and tracks how your exposure to them evolves over a flying career. Point it at a single flight for a detailed debrief, or at your whole logbook to see the bigger picture.

Single-flight debrief

One IGC file becomes an interactive map, synced altitude/speed/risk plots, a 3D terrain replay, and a table of every flagged episode and thermal climb.

Career trends

Every event from every flight, smoothed into rate curves over your accumulated flight hours — so you can see whether experience is actually making you safer.

Terrain-aware

SRTM elevation, a database of landable fields, and a ridge database derived from watershed analysis let the model reason about terrain clearance, ridge crossings and glide range.

One engine, everywhere

The same Swift analysis engine powers the browser app (compiled to WebAssembly), the macOS trends app, and the in-flight iOS cockpit companion — verified numerically identical.

Tour

A tour of the app

Real screenshots, real flights. Everything below is one click away in the web app.

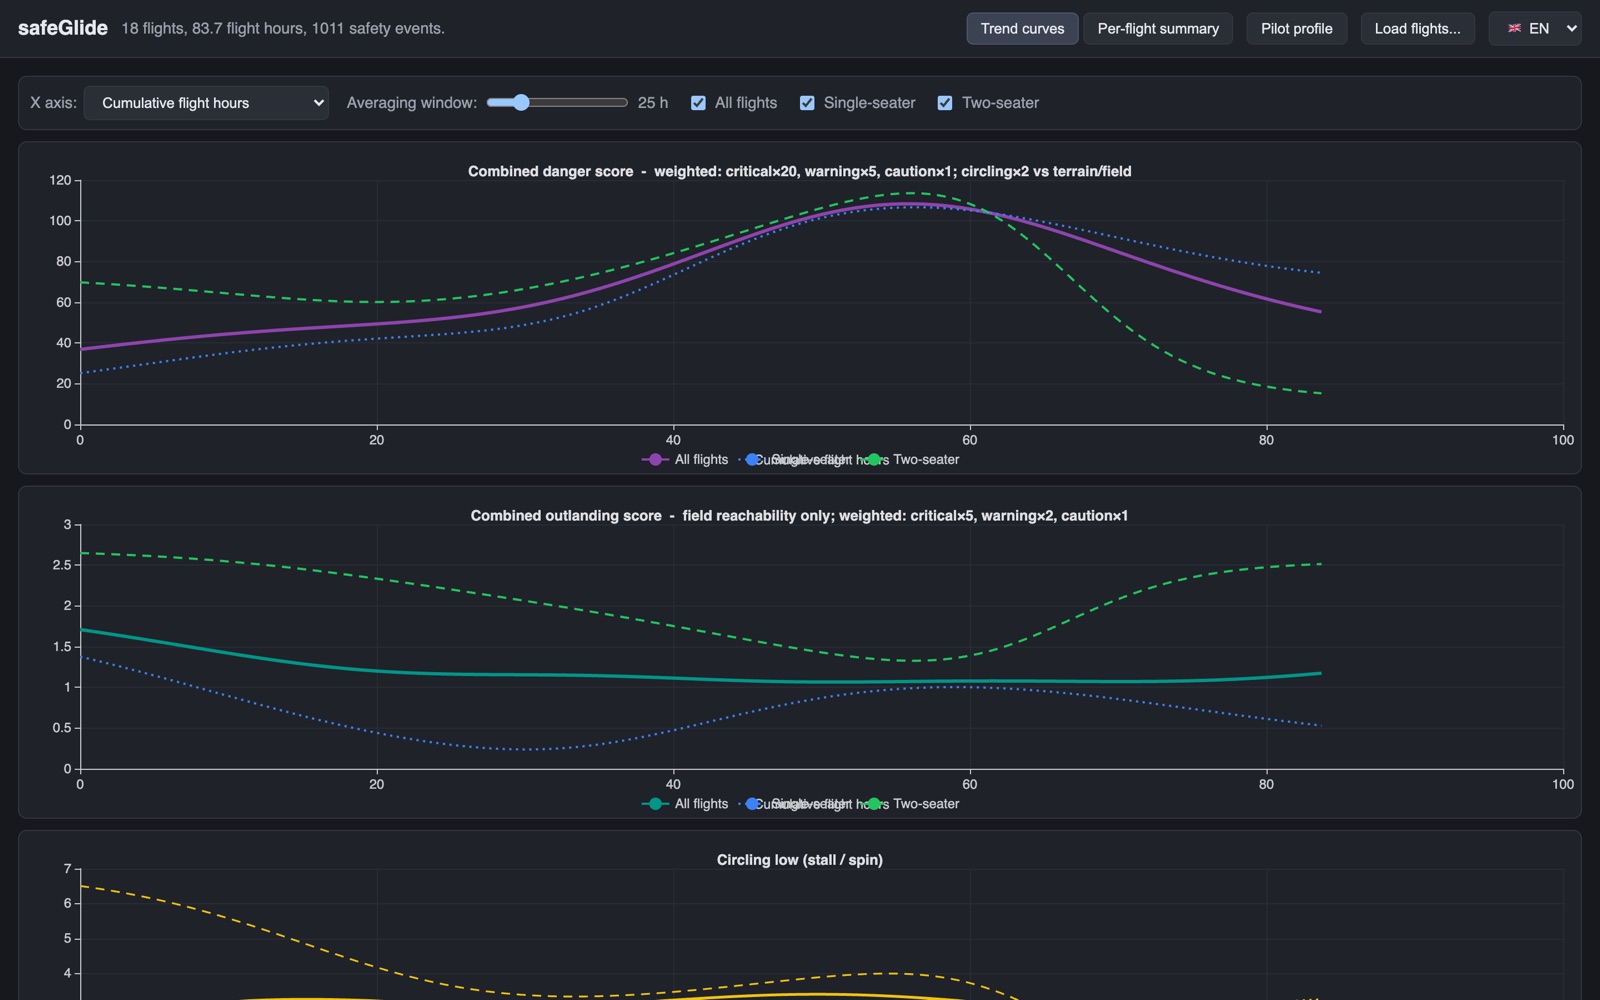
Career trend curves: combined danger score and outlanding score over cumulative flight hours
18 flights, 83.7 hours, 1011 events — smoothed into trend curves.

Career trend curves

Your whole logbook condensed into a handful of honest curves.

  • Combined danger score — events weighted by severity (critical ×20, warning ×5, caution ×1), so one genuinely scary moment outweighs a dozen minor ones.
  • Per-detector rates — circling low, low & slow, ridge crossings and field reachability each get their own curve.
  • Adjustable smoothing — Gaussian averaging over flight hours, with single-seater and two-seater flying separated.
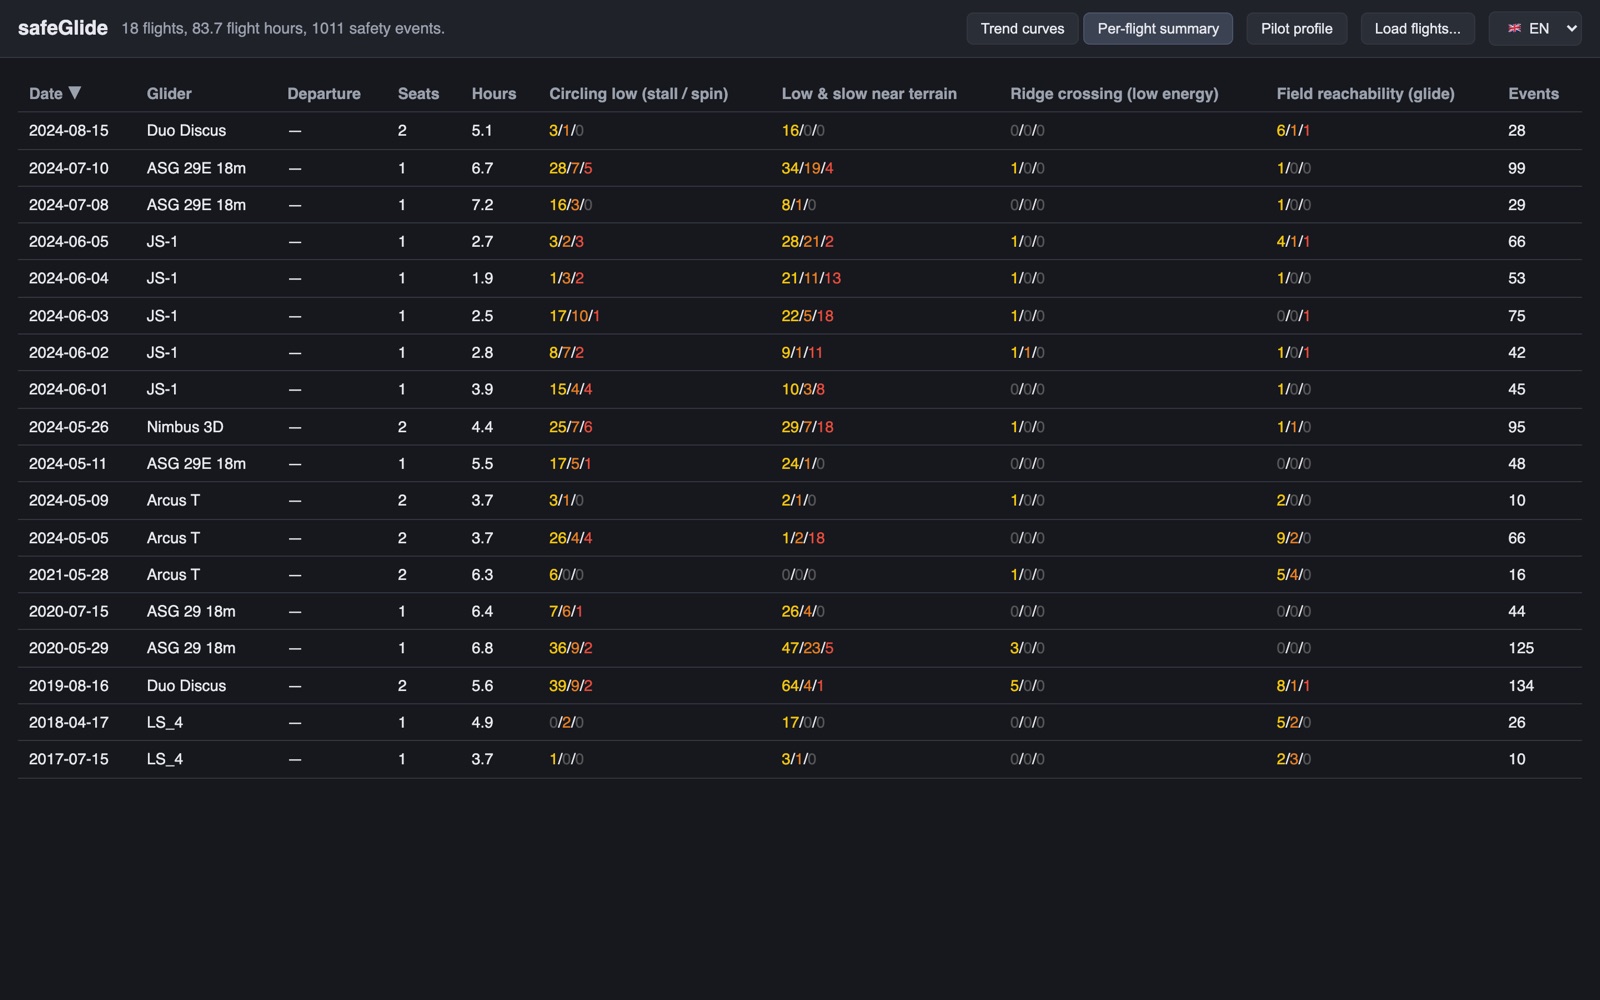
Per-flight summary table with caution/warning/critical event counts per detector
Caution/warning/critical counts per detector, one row per flight.

Per-flight summary

Every flight on one line: date, glider, hours, and colour-coded event counts for each of the four detectors. Sort by any column, spot the outlier days, and click a row to open the full debrief.
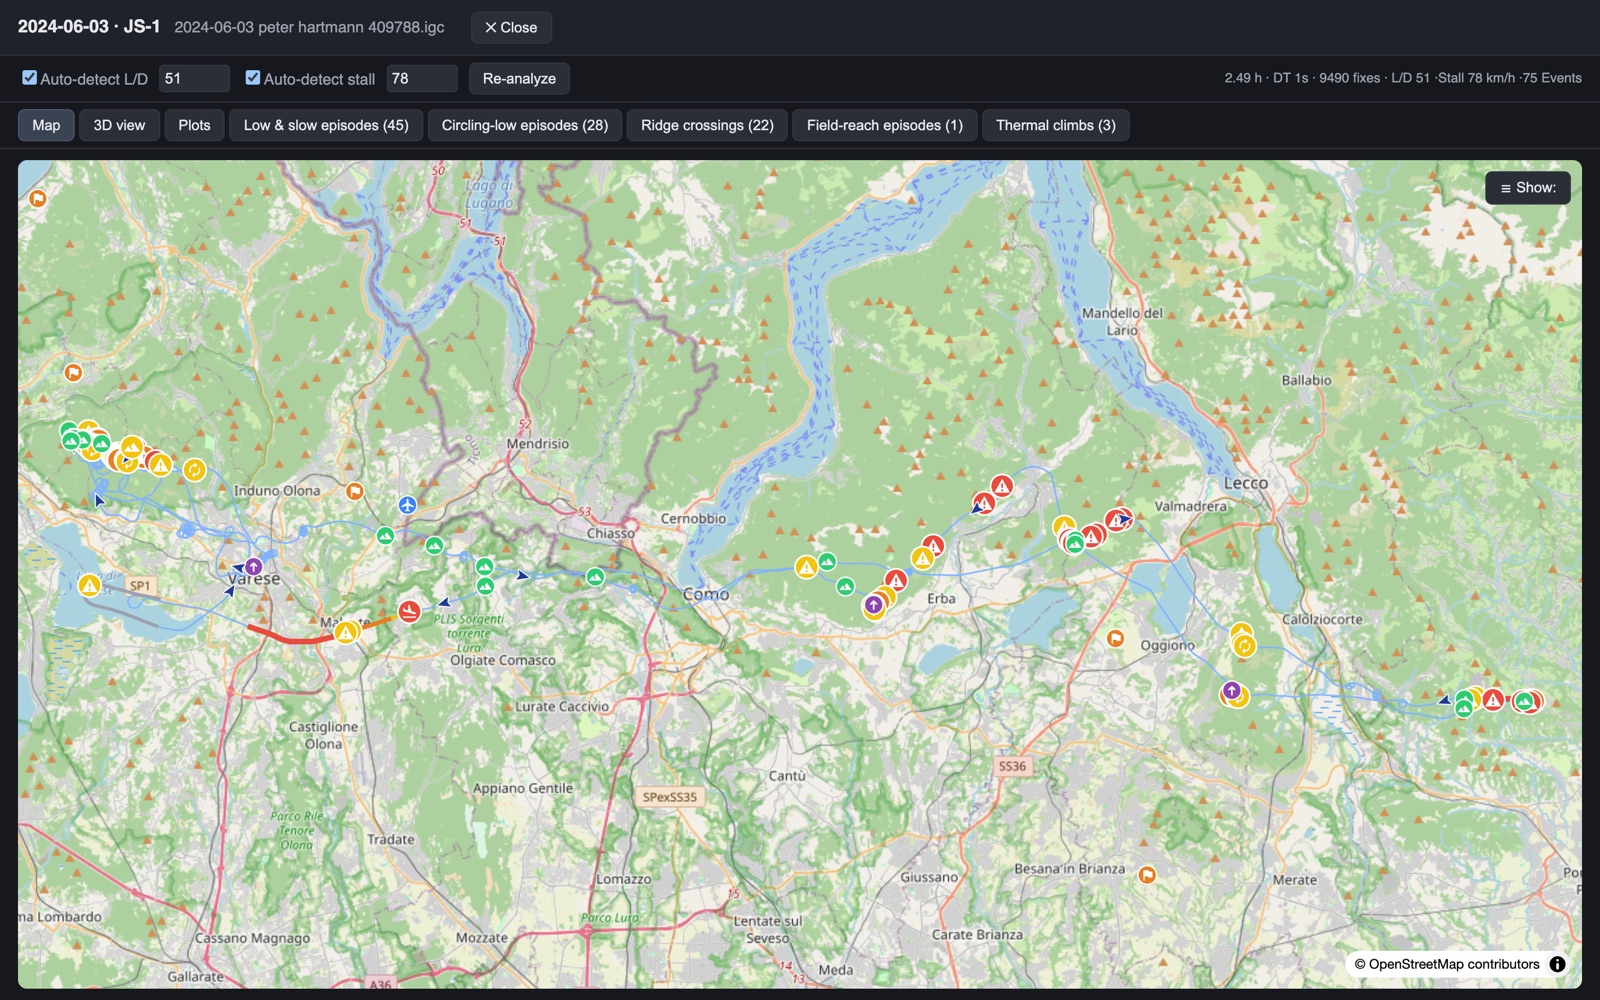
Flight map with graded event markers along an alpine flight near Varese, Como and Lecco
An alpine flight with every flagged moment pinned where it happened.

Interactive flight map

The full track with every event marked in place and graded by severity — plus thermal climbs, ridge crossings, landable fields and airports. Toggle layers to focus on what you care about, and jump from any marker straight into a 3D replay.
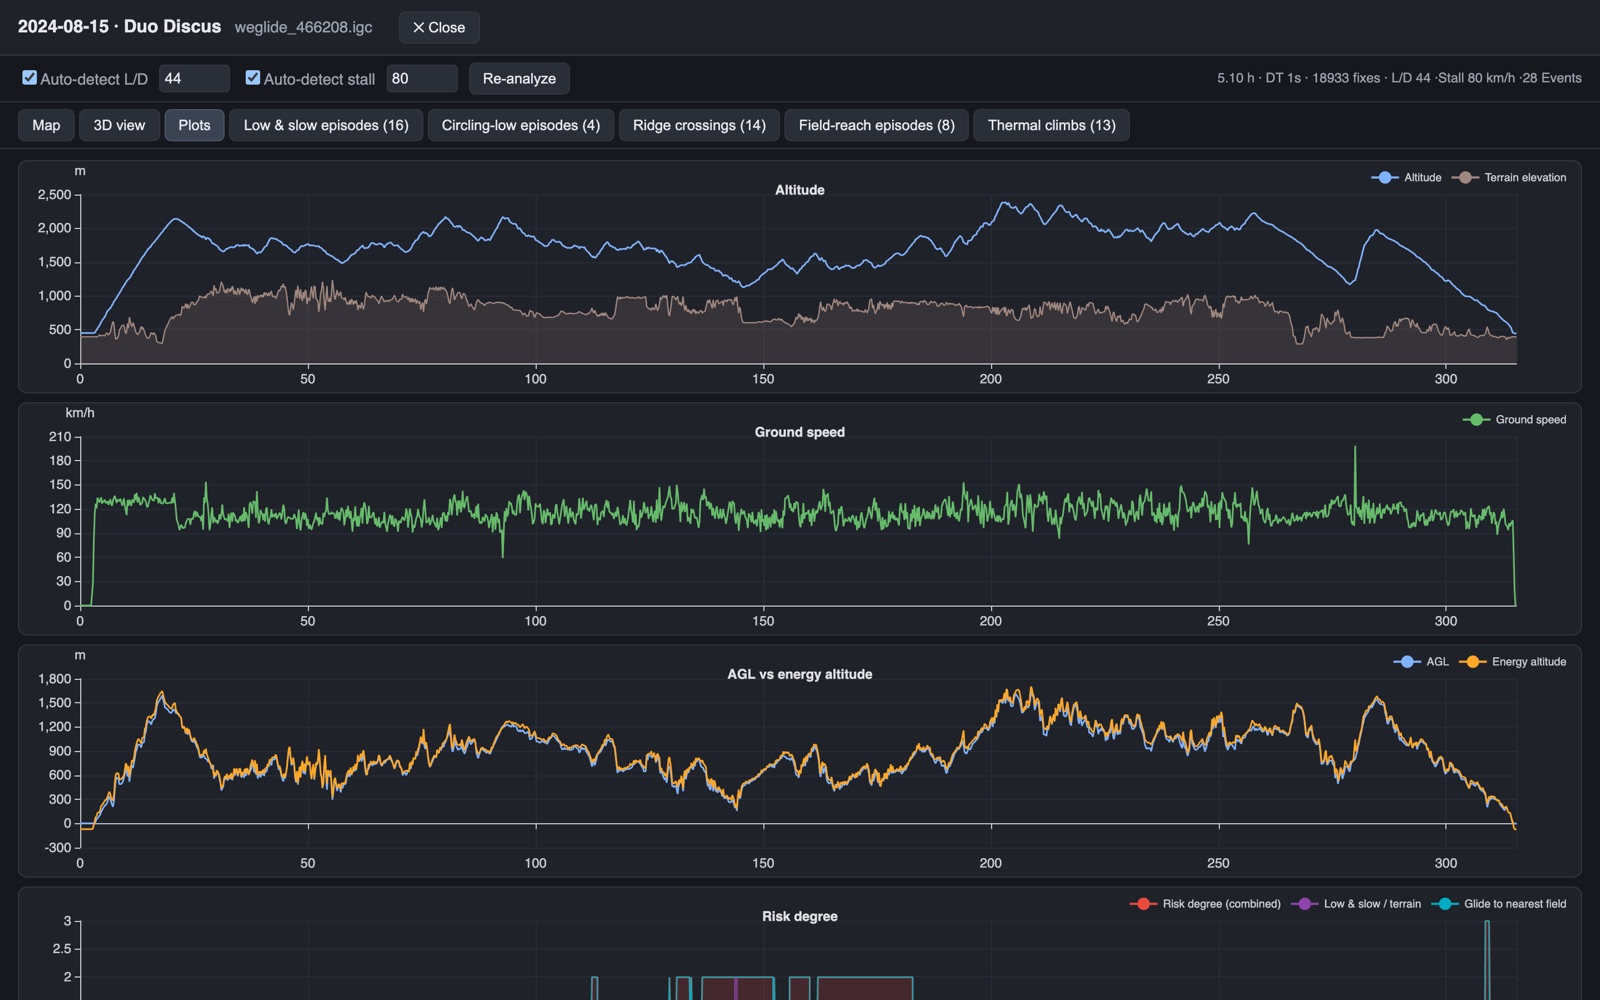
Synced plots: altitude vs terrain, ground speed, AGL vs energy altitude, risk degree
Altitude vs. terrain, ground speed, AGL vs. energy altitude, risk degree.

Synced timelines

Four stacked plots tell the story of the flight minute by minute:

  • Altitude against the terrain profile beneath you.
  • Ground speed with the stall margin in view.
  • AGL vs. energy altitude — the model is energy-aware: speed you can trade for height counts.
  • Risk degree — when and why the model got nervous.
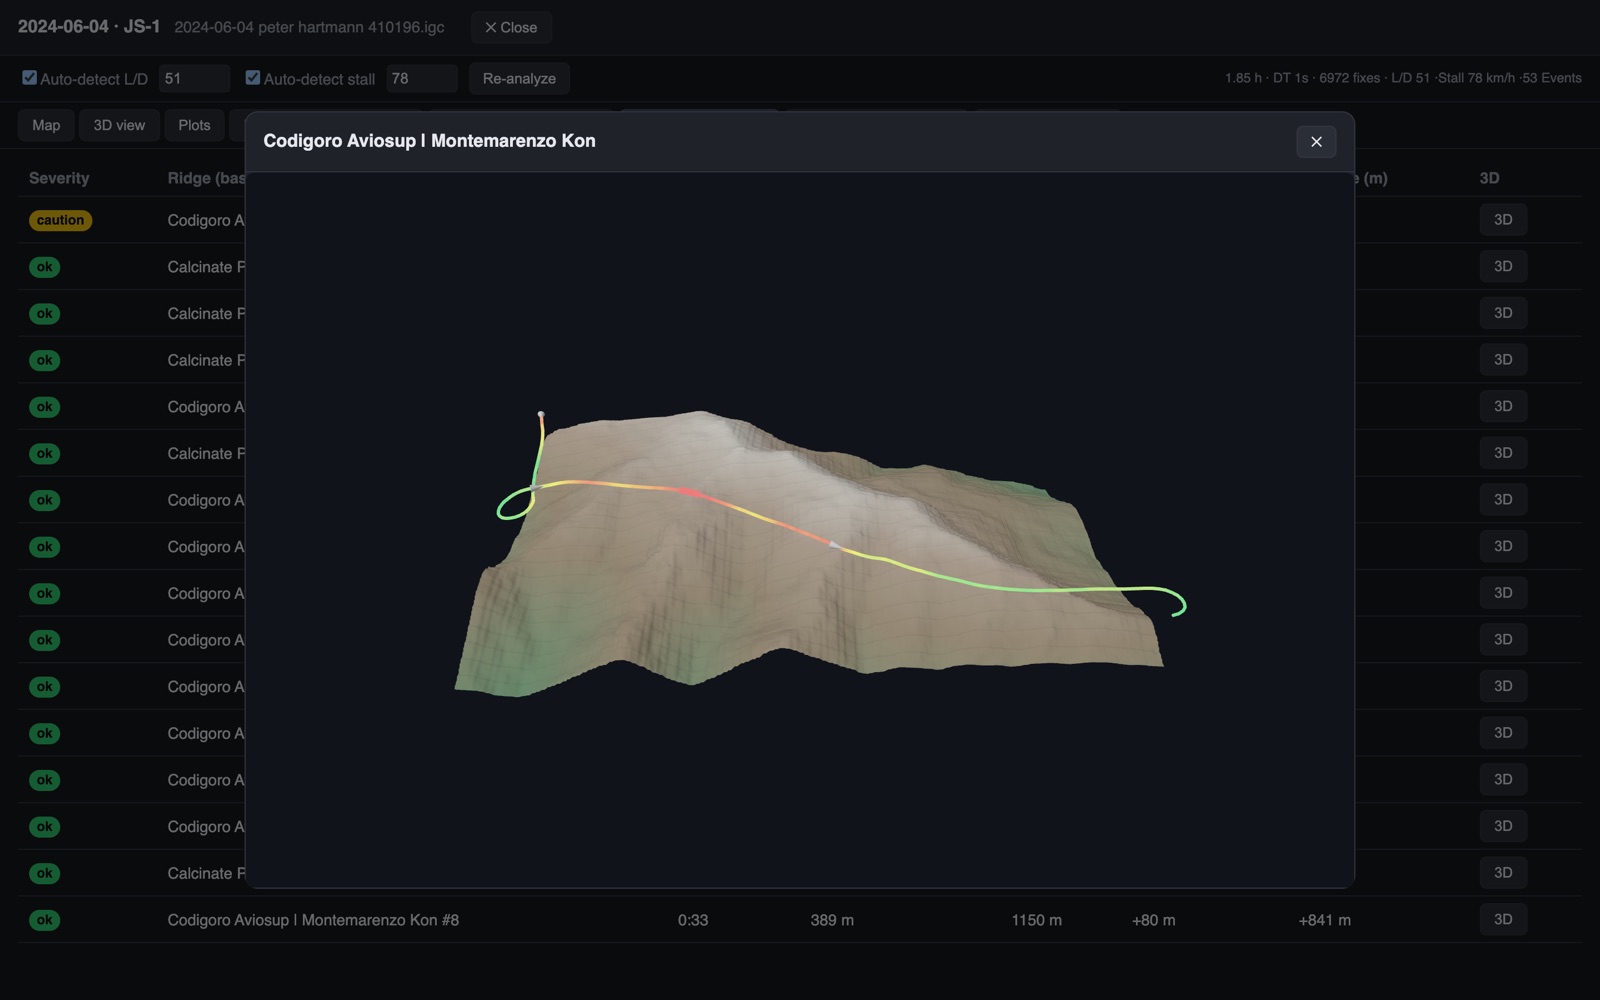
3D episode replay of a low-energy ridge crossing, track coloured by risk
A single episode in 3D — the track turns red exactly where margins vanished.

3D episode replay

Every flagged episode, ridge crossing and low save can be opened as a 3D scene: real terrain, the track draped over it and coloured by risk. It's one thing to read "crossed the ridge with 70 m clearance at low energy" — it's another to see it from outside the cockpit.

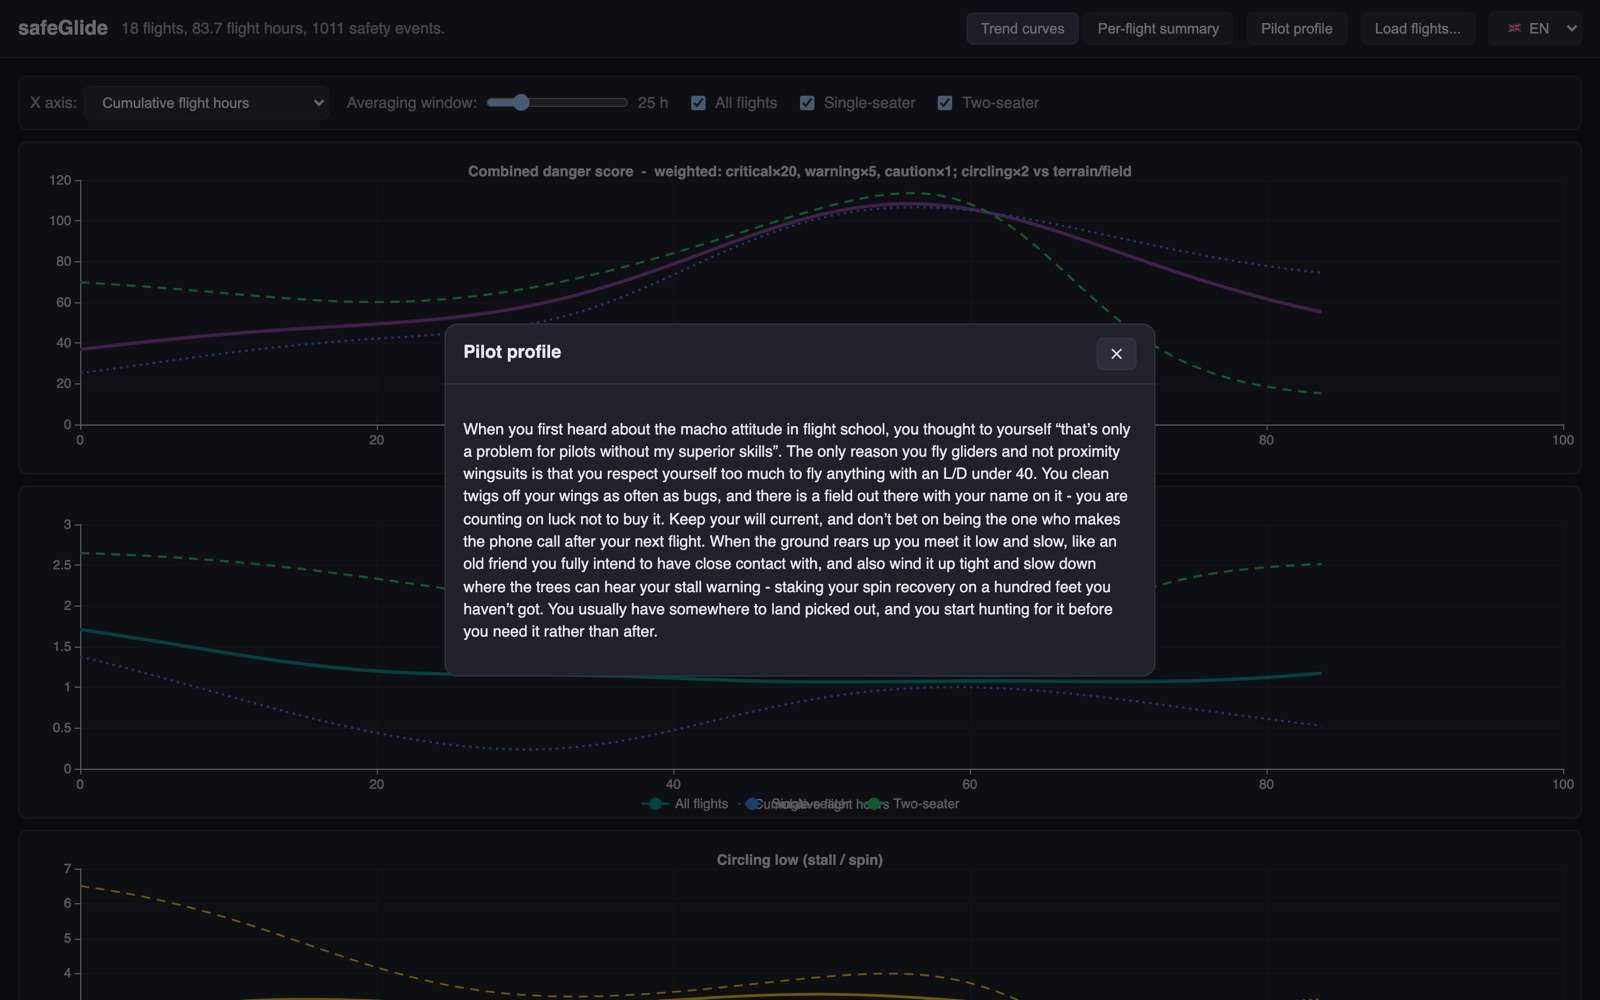
Pilot profile: a written, plain-language summary of your flying patterns
The written profile pulls no punches.

Your pilot profile, in plain words

After analysing your logbook, safeGlide writes you a short profile — in English, German or French — describing the habits it found: where you take your risks, what you're conservative about, and what the numbers say you should hear. It is deliberately direct; a debrief that flatters you teaches you nothing.

The model

What safeGlide watches for

Four detectors, each aimed at a flight state the accident record keeps pointing back to. Every event is graded:

caution warning critical

Circling low

Thermalling close to the ground — the classic stall/spin setup. Tightening a turn at an altitude where a departure is unrecoverable.

Low & slow near terrain

The soaring squeeze: low and slow and close to rising ground at the same time, with little energy in hand to fix any of it.

Ridge crossing at low energy

Crossing a ridge line with minimal clearance and no speed reserve — flagged against a real ridge database, not just an altitude threshold.

Field out of reach

Moments when no landable field remained within conservative glide range — computed from your glider's actual performance and the terrain in between.

The model is energy-aware — excess speed counts as convertible altitude — and it knows the difference between deliberate ridge soaring and an accidental squeeze. The goal isn't to second-guess any single decision, but to surface the patterns you don't notice flight-to-flight.

Evidence

What the accident record shows

safeGlide watches the flight states that the accident record keeps pointing back to — low, slow, and close to terrain. Here's why those are the ones worth watching.

Loss of Control: 7 (19%)Terrain/Obstacle/Wire Impact: 7 (19%)Stall/Spin: 6 (16%)Off-field/Outlanding: 3 (8%)Pilot Incapacitation/Medical: 2 (5%) — outside scopeWinch/Tow Launch Failure: 8 (22%)Approach/Landing: 2 (5%)Midair Collision: 2 (5%) 19%19%16%8%22% 62%of causessafeGlide watches MONITORABLE  62%Loss of Control — 7 (19%)Terrain/Obstacle/Wire Impact — 7 (19%)Stall/Spin — 6 (16%)Off-field/Outlanding — 3 (8%)OUTSIDE SCOPE  38%Pilot Incapacitation/Medical — 2 (5%)Winch/Tow Launch Failure — 8 (22%)Approach/Landing — 2 (5%)Midair Collision — 2 (5%)
Cause of 37 Swiss (SUST/STSB) glider-accident final reports, 2004–2024. 3 reports with an undetermined cause are excluded from the base. 23 of 37 (62%) involve flight states safeGlide directly monitors — low, slow and close to terrain. Pilot medical incapacitation is counted as outside scope: a real cause of accidents, but not a flight-path pattern any track-based analysis could catch. safeGlide is a post-flight self-study tool, not a certified safety device.
Workflow

How it works

Three steps from logbook to insight — entirely in your browser.

  1. Bring in your flights

    Drop .igc files or whole folders onto the page, or enter your WeGlide user name and let safeGlide pull your own flights directly. One flight or a twenty-year logbook — both work.

  2. Automatic analysis

    The engine — the same Swift code that powers the native apps, compiled to WebAssembly — reconstructs each track, detects your glider type to set its performance (L/D, stall speed; you can override both and re-analyse), and grades every risky moment against terrain, ridge and landing-field databases. Nothing is uploaded anywhere.

  3. Review the results

    Debrief a single flight on the map, plots and 3D replay — or step back and watch your event rates trend across months and years of flying. Then read your pilot profile and see if you agree with it.

Get started

Getting started

⚠️ Not a certified safety device. safeGlide is a personal analysis project for post-flight review and self-study. It is not avionics, not certified, and must never be relied on for in-flight decision-making. Always fly within your own training, currency and judgement.

See your own flying in a new light

Drop in last season's logbook and find out what your trend curves have to say.